-
Bad Experiments
Like so many middle aged ladies with poorly-managed health problems, I spend more time than is strictly necessary browsing PubMed. My genre of choice would be studies trying to determine if a drug that is already approved for something (anything) might possibly be effective at preventing migraines.
Like any sort of genre writing, these all fit a pattern. Patients are recruited (tbh, the exclusion criteria are pretty darn interesting most of the time). Their baseline rates of migraine are measured; they are excluded from the study if they are having too many headaches per month. The patients then spend a few weeks in a wash-out phase, where they go off whatever previous migraine preventative medication they were taking. Next, they take several weeks (sometimes months) reaching the assigned dose of the medication being studied. Even though these studies are double-blinded, a lot of these medications have side effects that you can not ignore (for example, tingling in hands and feet and everything tasting like metal). Finally, they spend a few months recording how many migraines they are having. And then the researchers use statistical tests that are based on assumptions of normality on this (bounded) count data.
I do not have access to hundreds of patients, an IRB, or any of the other infrastructure that you need to run a medical study. What I do have is a leftover bottle of a medication that is not FDA-approved to say that it prevents migraines – but which did a remarkably good job of making my mysterious neurological symptoms from this summer, which were probably weird migraine auras, go away entirely. I also have an appointment with my regular neurologist tomorrow. And I keep good records.
At the end of August I went through a wash-out phase. Two of my neurologists (my regular neurologist and one of the vascular neurologists) told me to stop taking the medication that seemed to be working. I grudgingly agreed. And then I was scheduled for a few EEGs, so I stayed off this medication so that it would not interfere with the results of these tests (they came back normal). After the two-week wash-out phase, I was off the medication for an additional 91 days. During these 91 days, I had 33 headache days and 58 headache-free days.
Then I started taking the medication again. Today is the 22nd day that I have been on it, so I’ve been on it for 21 full days. During this time I have had two headache days. And so the question is whether \(\frac{2}{21}\) is sufficiently different from \(\frac{33}{91}\) for me to continue taking this medication. Really the question is whether I can convince my regular neurologist that these numbers are sufficiently different from one another for him to write me a prescription for this medication (on which I feel much better and experience no side effects).
One of the few things that I remember really clearly from the graduate courses I took in statistics is that count data is described by a Poisson distribution and not a normal distribution. So I’m wary of using any tests that rely on assumptions of normality.
The chi-square test is one of my favorite tests, but with fewer than five headache days while taking this medication, is it even appropriate here?
> chisq.test(matrix(c(33, 2, 58, 19), nrow=2))

	Pearson's Chi-squared test with Yates'
	continuity correction

data:  matrix(c(33, 2, 58, 19), nrow = 2)
X-squared = 4.5022, df = 1, p-value = 0.03385
And what about Fisher’s Exact Test? It’s great for count data, even when the counts are small (as we hope they are when we are trying to count the number of headache days with the experimental treatment). Here I worry that test expects the margins on the table to be fixed. And that won’t happen unless I can get enough more of this medication so that I can be on it for 91 days, so I shouldn’t expect my data to reflect a hypergeometric distribution.
> fisher.test(matrix(c(33, 2, 58, 19), nrow=2))

	Fisher's Exact Test for Count Data

data:  matrix(c(33, 2, 58, 19), nrow = 2)
p-value = 0.01853
alternative hypothesis: true odds ratio is not equal to 1
95 percent confidence interval:
  1.167942 50.180692
sample estimates:
odds ratio
  5.342414
And what if I look at the 21 days before I started taking this medication? Then I could have fixed margins. Ten headache days, 11 headache-free days (which is kind of what motivated me to rummage through my medicine cabinet looking for something that works).
> fisher.test(matrix(c(10, 2, 11, 19), nrow=2))

	Fisher's Exact Test for Count Data

data:  matrix(c(10, 2, 11, 19), nrow = 2)
p-value = 0.01479
alternative hypothesis: true odds ratio is not equal to 1
95 percent confidence interval:
  1.38263 90.38692
sample estimates:
odds ratio
  8.185283
Back when I was first learning about statistics, no one talked very much about Barnard’s test. I’m not entirely sure when it applies. (Or, if we’re being entirely honest here, what sort of underlying probability distribution describes the “let’s try taking some leftover medicine until we run out of it” experimental design. And, to continue with the real talk, I can not promise you that headache days and non-headache days are independent. There might be some sort of underlying Markov process where the probability of having a headache tomorrow depends on whether or not I have a headache today.)
> barnard.test(33, 2, 58, 19)

Barnard's Unconditional Test

           Treatment I Treatment II
Outcome I           33            2
Outcome II          58           19

Null hypothesis: Treatments have no effect on the outcomes
Score statistic = -2.38298
Nuisance parameter = 0.957 (One sided), 0.957 (Two sided)
P-value = 0.0206766 (One sided), 0.0206766 (Two sided)
And even if you accepted that I have a baseline headache rate of \(\frac{33}{91}\), you could calculate the binomial probability of having less than or equal to two headache days in a 21-day period. I calculated \[\binom{21}{2} \left(\frac{33}{91}\right)^2 \left(\frac{58}{91} \right)^{19} + \binom{21}{1} \left(\frac{33}{91}\right)^1 \left(\frac{58}{91} \right)^{20} + \binom{21}{0} \left(\frac{33}{91}\right)^0 \left(\frac{58}{91} \right)^{21} ,\] which is roughly 0.0063.
I really do feel like it is working.
-
In Case You Had Any Doubts
An article in today’s New York Times ties in to the whole New Years resolution tradition and notes:
Surely by now you’ve heard of the psychologist Walter Mischel’s famous marshmallow experiments, in which children who could resist the temptation to immediately eat one sweet would be rewarded with a second sweet about 15 minutes later. Professor Mischel found that those who could wait — those who had self-control — were also the ones who had better academic and professional success years later.
I am pretty sure that my past self would have eaten the marshmallow and then ransacked the room to find the bag with the rest of the marshmallows in it and then eaten all of them, too.
Good thing, though, because if I had any reasonable amount of this so-called “grit,” I would be so successful that everyone would hate me as much as they hate Lena Dunham.
-
Quilting Combinatorics
Back near the end of the summer, I got a lot of sewing done. Specifically, I made a lot of progress using up fabric that I already owned, and I made six quilt tops (two queen size and four crib size). Today, in preparation for the upcoming termite tenting in my building and all its weird rules about things that contain air wrapped in plastic – such as an unopened queen size quilt batt – I brought three more quilt tops to the long-arm quilting shop to be professionally quilted, including one of the queen size quilts.
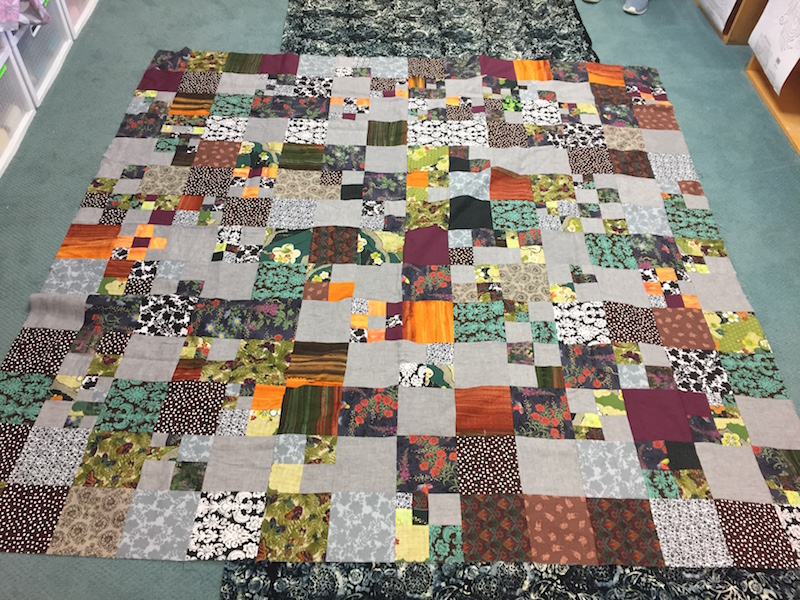
The major design theme of this quilt was “use up fabric that you already own.” About a quarter of the squares were the same grey linen that I’ve also been using to make my ridiculous shopping bags.
I happen to have owned a lot of grey and brown and green fabrics, so I cut them up into 6-inch squares (finished sized). Once there weren’t any pieces left that were big enough to make 6-inch squares, I cut the rest of the scraps into 3-inch and 2-inch and 1.5-inch squares. And once I had enough squares and sub-squares, I sewed all the sub-squares together into 6-inch squares. Next, I sewed my squares together into 14 strips that were each 14 squares long. Finally, I sewed those 14 strips together into the quilt top.
The tricky part happened once I reached the last stage. Earlier on I had just sort of assumed that I did not want to have any identical squares next to each other. When I was working with the small squares, this was easy. When I was sewing the 6-inch squares together into the 1-by-14 strips, this was also easy: It was easy to tell if I was about to sew two identical squares to each other and then just rotate a sub-strip by 180 degrees (pi radians, for you purists) or do some other easy swap.
However, once I reached the point where I had 14 strips, it was a lot harder to tell if any given pair would have identical squares touching if you sewed their long sides together. (I live in a small apartment, and the strips were each seven feet long.) Even worse, if a given pair were incompatible and I switched one out at random, would I just end up having identical squares touch later in the process with no way out?
My solution to this problem was to give up early and make sure that I had more than one pair of identical squares touching – so that it would look like it might be intentional. But now I am thinking of writing a combinatorics problem where if you know the number of squares of each color (and the size of the quilt), you would find the probability that you could assemble all the strips without identical patches touching each other.
-
People Paid A Lot to Park Downtown This Year
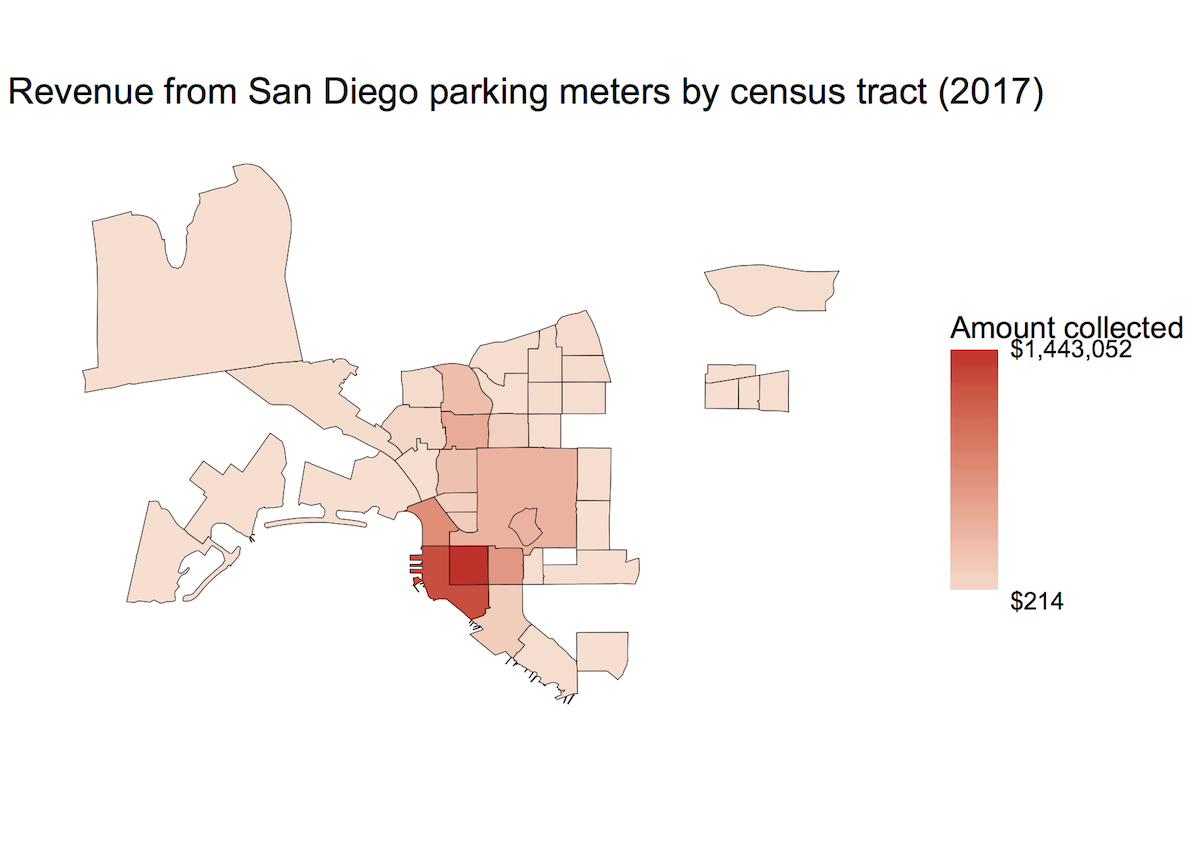
Recently I’ve been working with a lot of GIS data, and I’ve been having a lot of fun making maps of the form “find the total value of some feature that can be attributed to all the things located in some region.”
The city of San Diego data portal has a lot of free data that I can use. This particular example is parking meter revenue by census tract. I get my census data from TIGER/Line.
I got the locations of the parking meters and the monthly revenue per meter from the City of San Diego. Next, I further grouped the parking meter data to be annual revenue (current as of yesterday). I cleaned up the data a little bit because there is a parking meter pretending to be in the ocean and some NA values and such.
To get the longitude-latitude information about the parking meters to play nice with the shapefiles from the census, I needed to get them into a consistent coordinate system. At that point, the
overfunction was able to tell me which census tract each meter was located in. And then I could group by census tract.Finally, I converted everything to dataframes to plot with ggplot2. I also cropped the window to the uptown-downtown region of the city.
library(gpclib)
library(rgdal)
library(sp)
library(rgeos)
library(ggplot2)
library(scales)

# Parking meter data from City of San Diego
# https://data.sandiego.gov/datasets/parking-meters-locations/
# https://data.sandiego.gov/datasets/parking-meters-transactions/
# Download and save as meters.csv and transactions.csv in your working directory
# I manually took the spare meters out of the end of meters.csv
meters <- read.csv(file="meters.csv")
transactions <- read.csv(file="transactions.csv")

# Transactions for all of 2017
yr.transactions <- aggregate(sum_trans_amt ~ pole_id, data=transactions, FUN=sum)

# Converting from cents to dollars
yr.transactions$sum_trans_amt <- yr.transactions$sum_trans_amt / 100

# Combining locations with transaction totals
meters <- merge(meters, yr.transactions, by.x="pole", by.y="pole_id", all=TRUE)

# There is a meter with a bad value of longitude
meters <- meters[meters$longitude != -180,]

# Dropping rows with NAs
meters <- meters[complete.cases(meters),]

# Census tracts from... the census's TIGER/Line service
# Put the unzipped folder of shape files in your working directory
census.tracts <- readOGR(dsn="tl_2016_06_tract", layer="tl_2016_06_tract")

# Getting all the GIS data into the same spatial reference frame
coordinates(meters) <- ~ longitude + latitude
proj4string(meters) <- CRS("+proj=longlat")
meters <- spTransform(meters, proj4string(census.tracts))

# Which census tract is each meter in?
meters$tract <- over(meters, census.tracts)$GEOID

# What is the total value of sum_trans_amt added up in each tract?
the.values <- aggregate(sum_trans_amt ~ tract, data=meters, FUN=sum)

# We can also make a pretty picture with ggplot2
# Turn our GIS data into a dataframe and then merge (inner join)
census.tracts.fort <- fortify(census.tracts, region="GEOID")
the.values$tract <- as.character(the.values$tract)
my.geo.frame <- merge(census.tracts.fort, the.values, by.x="id", by.y="tract", all.x=FALSE, all.y=FALSE)
# Get all the vertices back in order
my.geo.frame <- my.geo.frame[order(my.geo.frame[,4]),]

# And now we can plot
ggplot(data=my.geo.frame, aes(x=long, y=lat)) + geom_map(map=my.geo.frame, aes(map_id=id, fill=sum_trans_amt), color="black", size=0.125) + scale_fill_continuous(low="#fee0d2", high="#de2d26", na.value="transparent", labels = scales::dollar_format("$"), breaks=c(min(my.geo.frame$sum_trans_amt), max(my.geo.frame$sum_trans_amt)), guide=guide_colorbar(title="Amount collected"))  + coord_map(xlim=c(-117.28, -117.05), ylim=c(32.67, 32.81)) + theme_void() + ggtitle("Revenue from San Diego parking meters by census tract (2017)")
-
Homework Bug Reports (Real and Imagined)
-
Sometimes, I accidentally press the wrong numbers, and then I find that the answer is wrong because I pressed those numbers. Can you please reload everything for me?
-
answer key funky
-
You are encouraging the use of casework instead of promoting more efficient methods by posting this solution. Please edit the solution!
-
I entered 216, and it is right, but it said it was wrong.
-
I had a little extra, and it marked me down for it.
-
I typed 196 by accident, and I clicked on enter instead of delete.
-
The answer is 10, and I typed \(1 + 2 + 3 + 4\), and it marked me wrong.
-
I did it a different way and got a different answer. You should accept all the answers.
-
The solution is not fully shown.
-
My mom typed the wrong answer before I solved the problem.
-
-
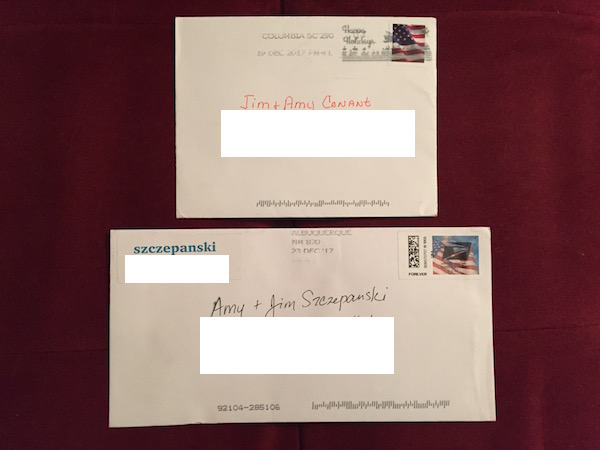
Cards
Our relatives are sending us Christmas cards.
-
Problems and Solutions
-
Still have terminal insomnia (not surprising, since I have had it since September). Gave in and went to be stupid-early last night so that I got a normal-people amount of sleep last night.
-
Last week I used an inner join where I should have used an outer join. Fixed that, and now I just need to recognize and track down the less obvious bugs. Downside to this being an inner join/outer join issue is that there is no justification to sing, “You put your left join in, you take your left join out…” to the tune of the hokey-pokey.
-
Someone gave me an edible gift that I have been told by my allergist that I should not eat. Brought it to work. (OK, and if we are being honest here, I ate some anyway. But I have an Epi-pen in my desk, so that should be fine. But I have also been told that, unlike expired Advil, expired Epi-pens are not that great, so maybe it is not as fine as I think? But I eat things that I am allergic to often enough that I think that I might have desensitized myself, as long as I keep eating them? Also months and months ago I stopped taking that other medicine that doesn’t work that makes you have to choose between dying of an allergic reaction and dying of an interaction between the medication and the Epi-pen, so that is a plus, I guess.)
-
Left my camera at home. Maybe I went home over “lunch” and got my camera and then stood around at the end of the runway for a while to get the interesting plane that was landing during the daytime. Felt like a totally not crazy person because there was someone else hanging out at the end of the runway with even more crazy person plane spotting gear.
-
Even more interesting plane is coming at night. Based on what I know about my cameras, my lenses, the locations near the airport where you can hang around without being hassled, the light situations at these locations at night, and my tripod (most importantly, the fact that it is at home because DAL8905 did not file a flight plan until after I was back at work, so I did not know that yet another interesting plane was coming today), I’m just going to go home and not head back to the airport. Do you want to come with me to the airport tomorrow or Thursday and pretend that we are parking a car so that I can try to photograph N674US from the top of one of the nearby parking garages before it leaves SAN?
-
Husband did not have to go to work today, so he went hiking. When I was home in the middle of the day to grab my camera, I set Roomba going. I think he dislikes Roomba almost as much as the cats do. I care about his opinion more than I care about the cats’ opinions.
-
Is this other medicine that is not supposed to work actually working? Not to jinx anything, but it looks like Barnard’s exact test might give us a meaningless number to “answer” this question before my next appointment with my regular neurologist!
-
Tomorrow we have the meeting with the termite contractor about all the things that we need to do to prepare for the termite tenting that is coming up in the near future. I have decided not to ask crazy questions, like whether the poison from the termite tenting will kill the ants. I’ve sort of gotten used to having ants. Now that the ants have started ignoring the cat food, I have gotten really good at ignoring the ants. I take secret delight that someone I know would find my ant nonchalance to be disgusting if I told her about it. But maybe the termite poison will also kill the ants?
-
subscribe via RSS