Making GIFs in My Free Time
We’ll see if this GIF stays animated once I put it on the web. It might depend on your browser and the whims of ImageMagick. It’s animated on Facebook, which is something.
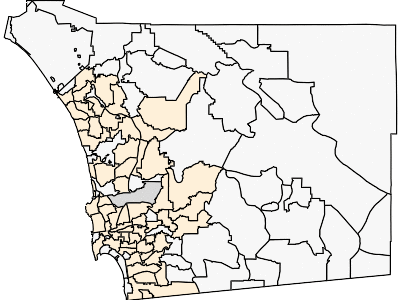
This GIF should be showing you the spread of COVID-19 through San Diego County, based on the total denisity of people infected (number of total cases per 10,000 population) by ZIP code. Orange-based colors are for ZIP codes with more than 10,000 people and more than 5 cases. Other ZIP codes are in gray-scale. Darker colors means a greater density of cases. Yes, this is total cases (not new cases). Yes, I might work on the GIF for new cases at some point, but this GIF was already kind of annoying to make.
Instead of devoting my recreational screen time to writing blog posts or watching TV or browsing knitting patterns that I might never make, I have been putting the infrastructure in place to make GIFs like the one I linked above. (But if it is not animating itself, I hope that the next version of it will stay animated.)
You might think: “Take some images, toss them in a directory, and then run ImageMagick over them all to get a GIF.” If you don’t know ImageMagick, it is the best ever command line tool for making images do things without having to open up some GUI-based software and click on things. You can script all sorts of amazing things with images.
Let me tell you about what it has taken me to create the images. I guess we’ll work backwards.
Each image comes from an SVG (scalable vector graphics file) that is created by the d3 data visualization library. For those outside of this field, this is a JavaScript library meant for displaying data on the web. My data is a tangled JSON object, and the array of ZIP code data holds an array of total number of cases in the ZIP code, by date. I can tell d3 to alter the fill color for each ZIP code based on the number of cases. Easy? Well, that is fine if you are showing the map on a web page (which d3 was designed for) and having the map update itself when you click a button on something, but I want to have this all work on in the background in the middle of the night and have a new GIF waiting for me each morning. We’re not there yet. I still need to meddle with the process in order to produce the GIF automatically.
Enter nodejs, which will let me run JavaScript on the server instead of in the browser. Also I needed a virtual DOM because there is no web page displaying the map when it is all running in the mind of the server, so I need to tell JavaScript that it should pretend that there is a web page so it would know where to put things. Also, JavaScript has some sort of weird stuff going on about things running synchronously vs. asynchronously, so I couldn’t just put my mapping function in a for loop and loop over all of the possible dates. I guess I could, but I didn’t really want to use Promises, which is how JavaScript deals with such things.
Can’t loop over all the dates inside JavaScript? Rewrote the JavaScript script to take a command line argument and then wrote a bash script to call the JavaScript via node at the command line. Each call to the JavaScript script writes out a frame. OK, now we have a way to make all the images. And then I can have the bash script call ImageMagick over the directory full of images and then move the finished GIF to the right place so that it can be served by the webserver.
Where does my JavaScript mapping script get the data from? It reads in a JSON file from disk. Where does this JSON file come from? The bash script tells a PHP script to make it. How does the PHP script make the JSON data? Well, it has a connection to a MySQL database that contains the information that it needs in order to build the JSON file. Eventually all the data came from the County’s data service.
The PHP script is a bit more than I’ve mentioned above. What it does is it checks the MySQL database to find the timestamp of the most recent update that it has from the County. If that timestamp is long enough ago that the County should have published more data by now, it makes an API call (this is a very annoying API, btw) to get the new data and processes it to save in the database. The PHP script can use all of the data (both new and old) in order to create the JSON object. Note that the County’s API limits the amount of information that it will send you in a single call so you can’t get all of the data over all time by sending one query to the API. You either need to do a bunch of calls (SLOW!) and string them all together, or else you need to cache the older data so that you only need to get a little bit from the County. I went with caching because this data is only updated once a day, so it seems silly to keep looking for it in The Cloud if you know that there won’t be any new data for many hours.
(Since I’m doing all this on a server that a friend lent me, not some sort of professional hosting, I had to install the webserver, the database server, etc. and configure them all to play nice together.)
I should clarify here, the County API provides the case count per day per ZIP code. It doesn’t tell me anything about the ZIP code boundaries. These I got from a shapefile from a different part of the County’s data stores. Did you know that professional geographers have all sorts of ways to encode locations on the surface of the planet? Those of us outside of the geography biz probably use latitude and logitude for this purpose. I know that the d3 mapping functions use latitude and longitude. There are several geographic coordinate systems that use latitude and longitude. The County’s ZIP code shapefile does not use one of them. Not only did I need to convert the shapefile to a data format that could be read in by d3 in JavaScript, but I also needed to convert the coordinate system to WGS84. I tossed this geographic information into a different table in my database, and whenever I get new data about COVID-19 case counts in the various ZIP codes in the County, I can join the data up on the ZIP code and then write out a JSON object that contains everything that my script needs to make the map: Boundaries of the ZIP code, population of the ZIP code (found in a different data source published by the County), and an array of the total number of COVID-19 cases in that ZIP code (since the County started publishing this).
Now I just need to put the finishing touches on the bash script and set it to run on a cron so that I can have a fresh GIF each morning. And this is why I have not been blogging. Once the code is nice enough that I’m not embarrassed by it, I might make the GitHub repo public so that other people can make their own GIFs in a similar way.