Sunday Scripting
Went to the coffee shop today to read the paper (OMG, why does the NYT insist on giving
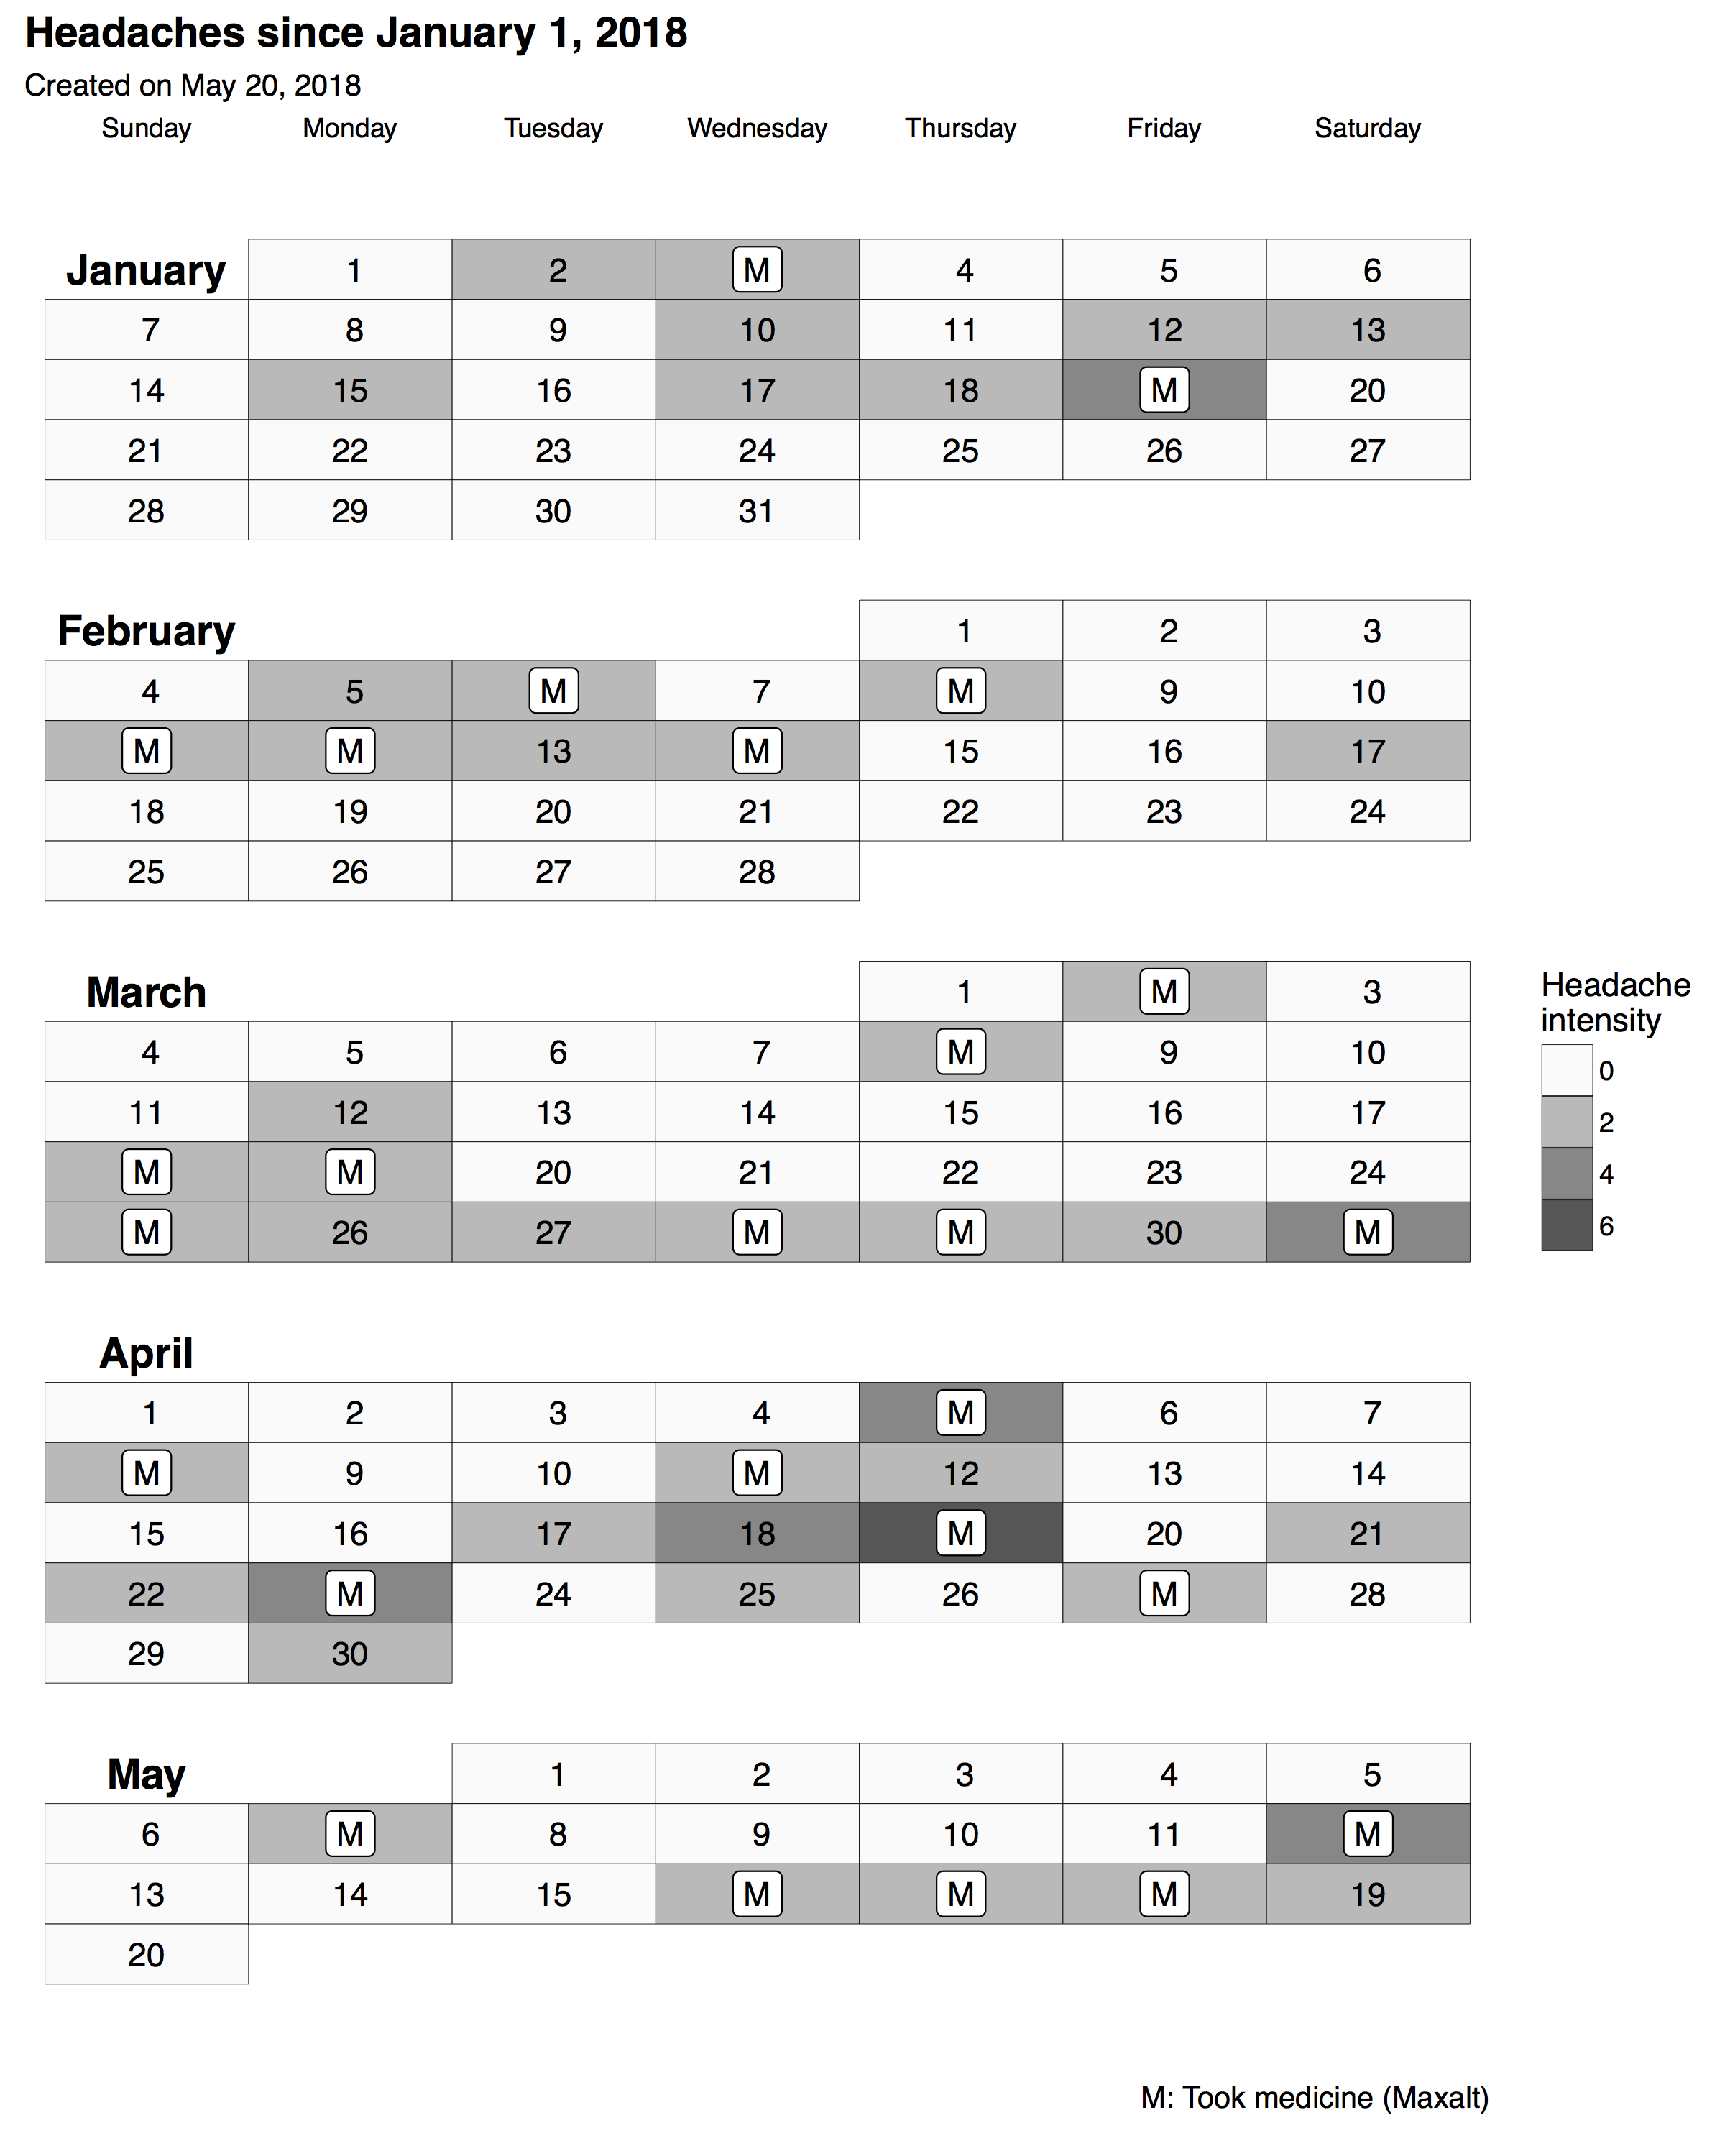
attention to horrible people?). Then I cleaned up the script that takes the headache
data from my phone and turns it into a calendar. It’s basically a ggplot2 graph with
a bunch of geom_tile(aes(x=weekday, y=extWOY, fill=as.factor(Headache)), color="black"),
where WOY means “week of year” (and “ext” means that there is a fudge factor to put a
blank row between months) together with scale_y_reverse() and a lot of
element_blank().
I’m not even going to bother running the statistics on whether or not the levetiracetam has an effect on my headaches because even if there is a statistically significant effect (and I am not convinced that there is one), it is so small that it does not matter for my quality of life.
I’m seeing the neurologist in about a month, so I want to send the office a message about the current state of things so that they can ask the insurance company if they would pay for the various things that they don’t want to pay for.