I've Actually Been Doing Much Better Lately
If I had run this code before emailing my neurologist, maybe I wouldn’t be giving one of those daily medications that I stopped taking another try. I’m actually doing quite well lately.
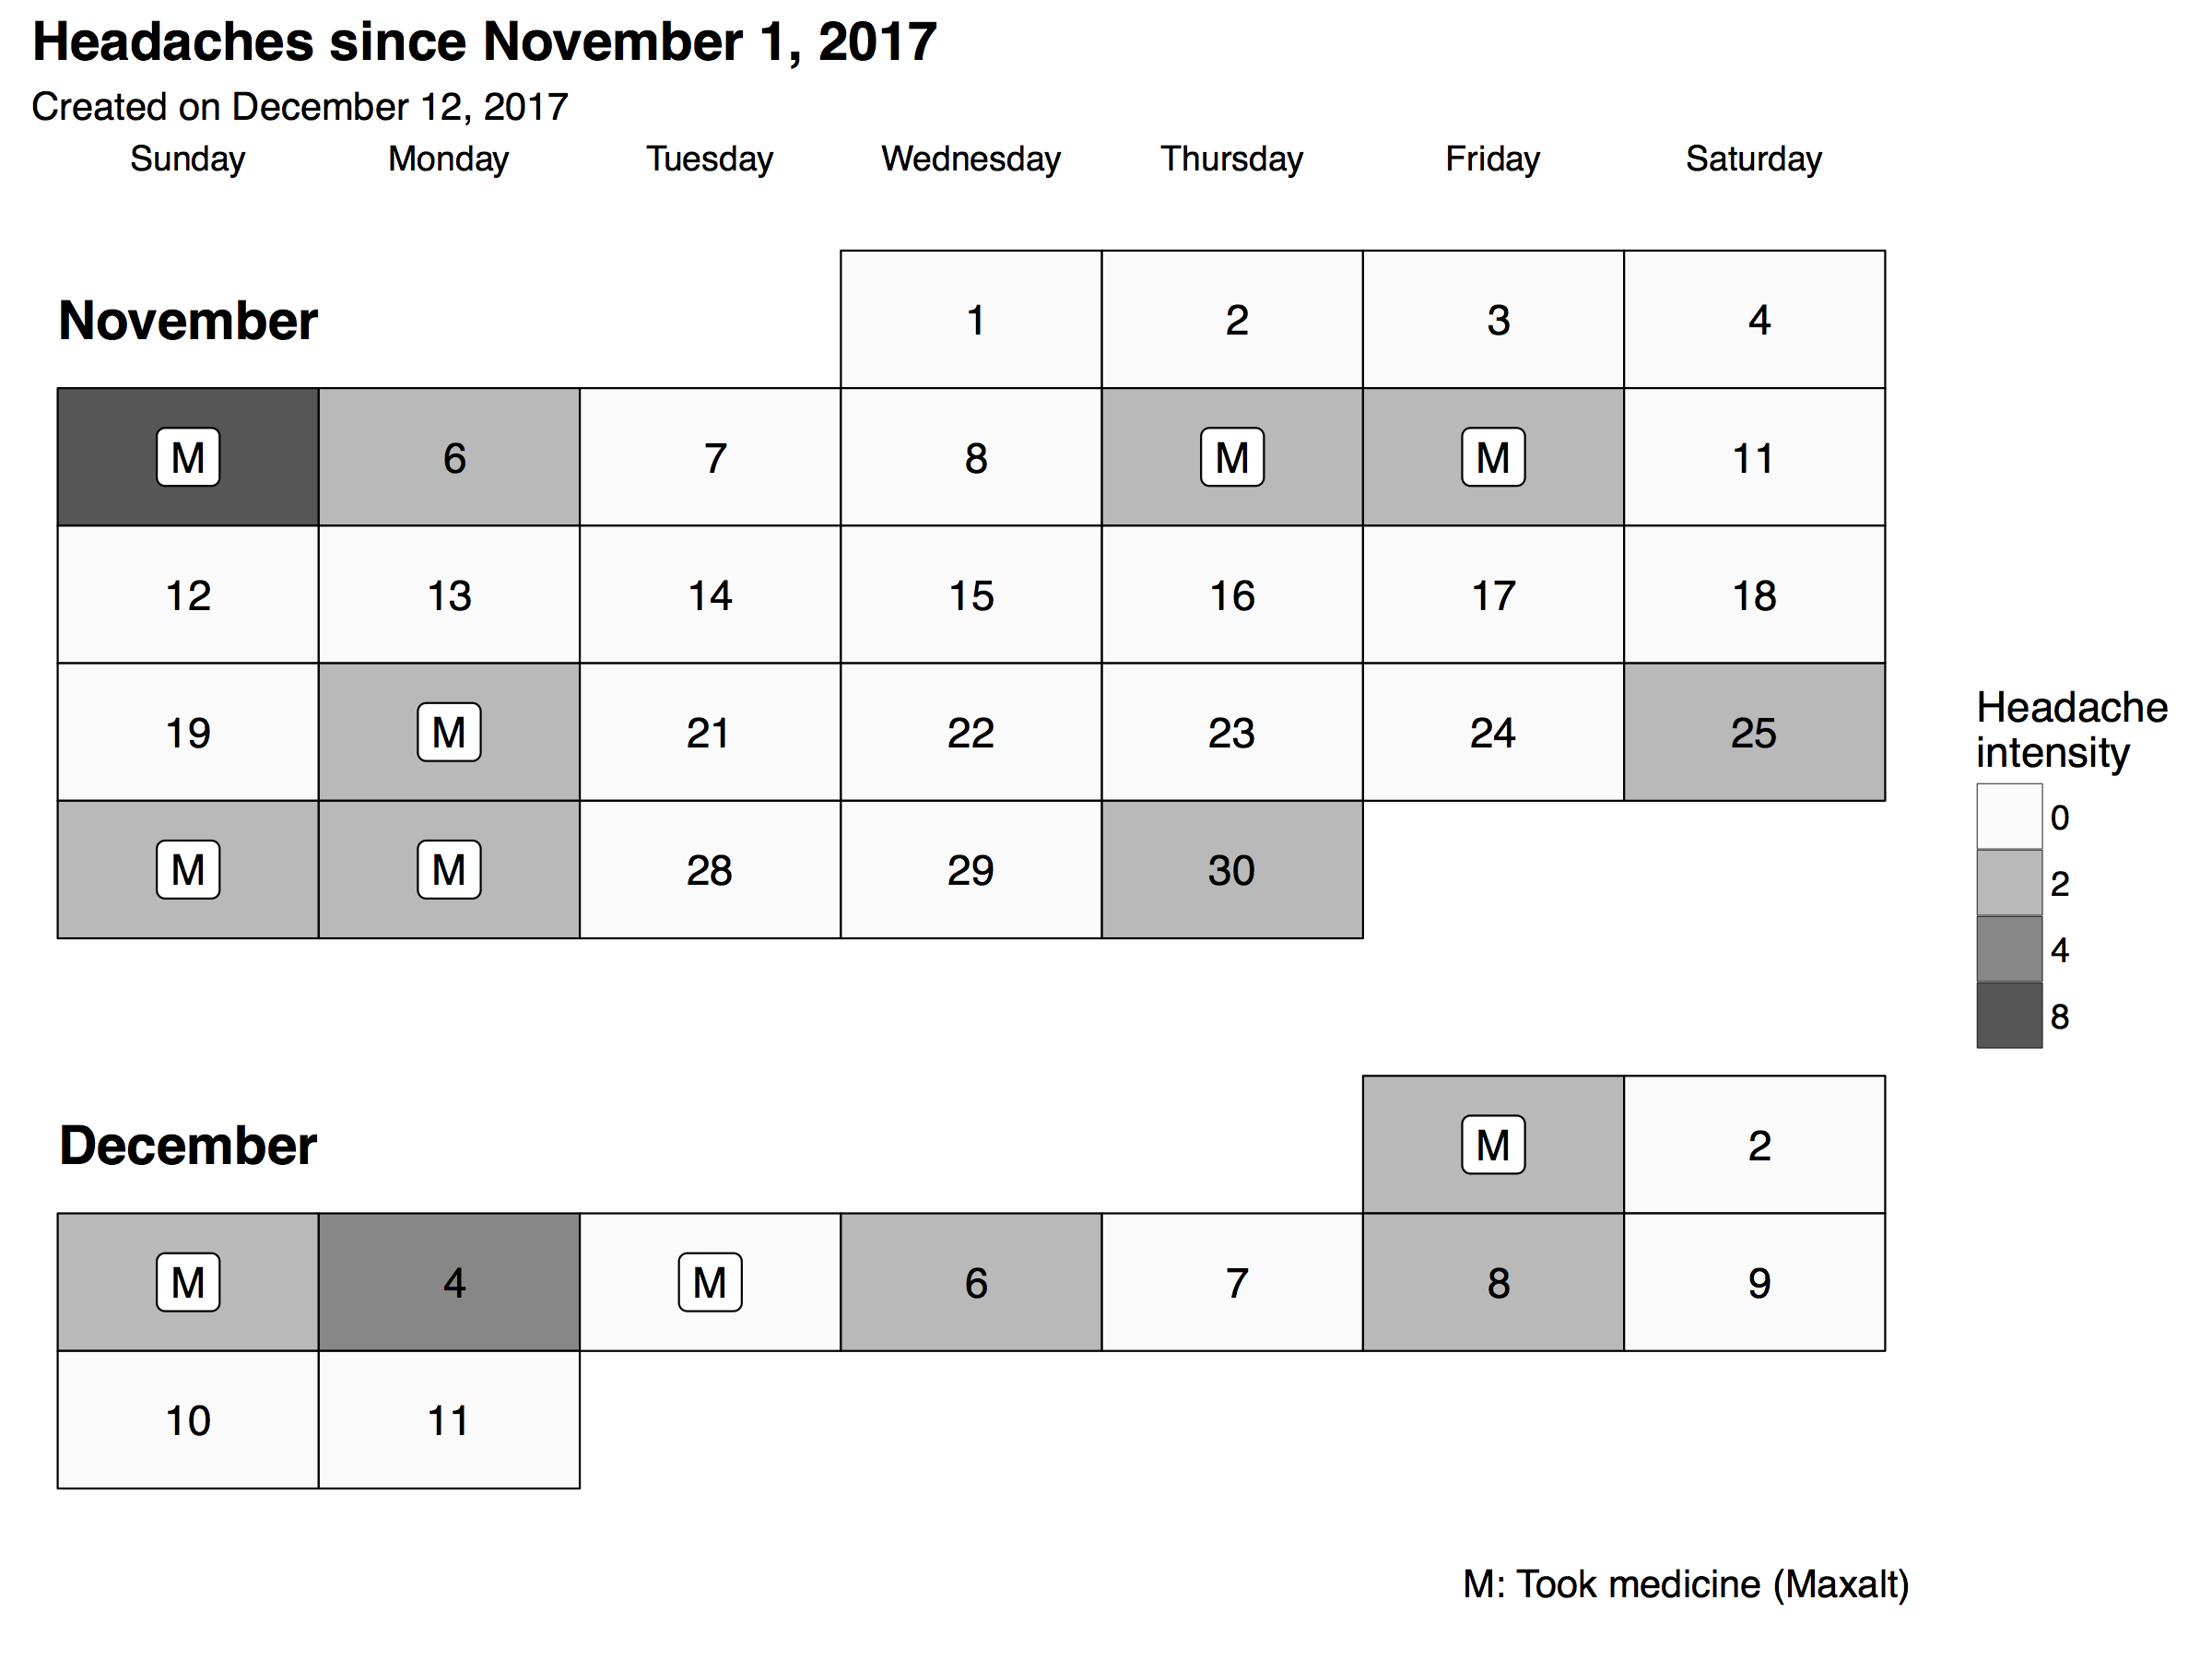
# Headache calendar
# Since I didn't expect to share it with anyone, a lot of things are hard-coded
# Maybe one day I'll turn this into a Shiny app.
# Symptom data from the Symple phone app.
# Medication data from a text file I keep in Dropbox.

library(ggplot2)
theme_set(theme_bw())

# Reads in the spreadsheet exported from the Symple phone app
symple.data <- read.csv(file="~/Documents/medical/headache-data/export-2017-12-12.csv", colClasses=c("factor", "NULL", "integer", "NULL", "NULL", "NULL"))

# Trying to rule out MOH
# I have a text file showing every time I took medicine
# First entry is a date
medicine <- read.csv(file="~/Documents/medical/headache-data/medicine.txt", colClasses=c("factor", "NULL", "NULL"), sep="\t", header=FALSE)

# Symple takes four readings a day. I want the maximum value of headache.
per.date <- aggregate(Headache ~ Date, data=symple.data, FUN="max")

# Their scale is 0-4, but I imagine it as the 0-8 pain scale.
per.date$Headache <- 2*per.date$Headache

# Days that I took medicine
per.date$Medicine <- per.date$Date %in% medicine$V1

# Day of week, for making the columns calendar
per.date$DOW <- as.POSIXlt(as.character(per.date$Date))$wday
per.date$weekday <- factor(per.date$DOW, levels=seq(0,6), labels=c("Sunday", "Monday", "Tuesday", "Wednesday", "Thursday", "Friday", "Saturday"), ordered=TRUE)

# Week of year, for making the rows of the calendar
per.date$WOY <- as.numeric(format(as.POSIXlt(as.character(per.date$Date)),"%W"))
per.date[per.date$DOW == 0, "WOY"] <- per.date[per.date$DOW == 0, "WOY"] + 1
per.date$extWOY <- per.date$WOY + 2*as.POSIXlt(as.character(per.date$Date))$mon

# Leftover from when I was in the hospital
per.date$Hospital <- per.date$Date %in% c("2017-08-05", "2017-08-06", "2017-08-07")

# Hard-coded subset for today's visualization
november.december <- droplevels(per.date[as.POSIXct(as.character(per.date$Date)) > "2017-10-31",])

# So many things are hard-coded
# A calendar is an array of tiles.
myplot2 <- ggplot(data=november.december) + geom_tile(aes(x=weekday, y= extWOY, fill=as.factor(Headache), size=as.factor(Hospital)), color="black") + geom_label(data= november.december[november.december$Medicine==TRUE,], aes(x=weekday, y=extWOY), label="M") + geom_text(data= november.december[november.december$Medicine==FALSE,], aes(x=weekday, y= extWOY, label=format(as.POSIXlt(as.character(Date)), "%e")))  + scale_fill_manual(values=c("#FAFAFA", "#BBBBBB", "#888888", "#555555")) + scale_size_manual(values=c(0.25, 1.5), guide="none") + scale_x_discrete(position = "top") + labs(fill="Headache\nintensity", caption="M: Took medicine (Maxalt)\n", title="Headaches since November 1, 2017", subtitle=paste("Created on", format(Sys.time(), "%B %e, %Y"))) + theme(plot.title = element_text(face="bold", size=14), axis.text.x=element_text(color = "black"), axis.text.y=element_blank(), axis.ticks = element_blank(), panel.grid.minor=element_blank(), panel.grid.major=element_blank(), axis.title=element_blank(), panel.border = element_blank()) + scale_y_reverse() + annotate("text", x=c(1), y=c(64), label=c("November"), color="black", fontface="bold", size=5) + annotate("text", x=c(1), y=c(70), label=c("December"), color="black", fontface="bold", size=5)

ggsave(filename="~/Desktop/headache5.pdf", plot=myplot2, width=8, height=6, units="in")